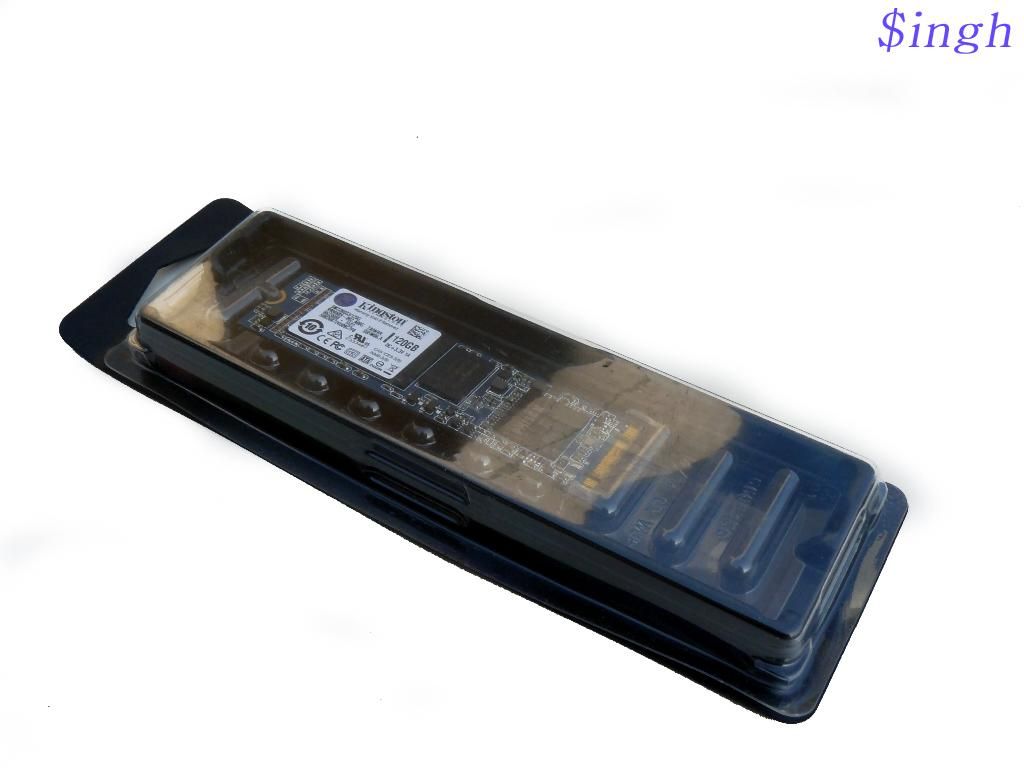
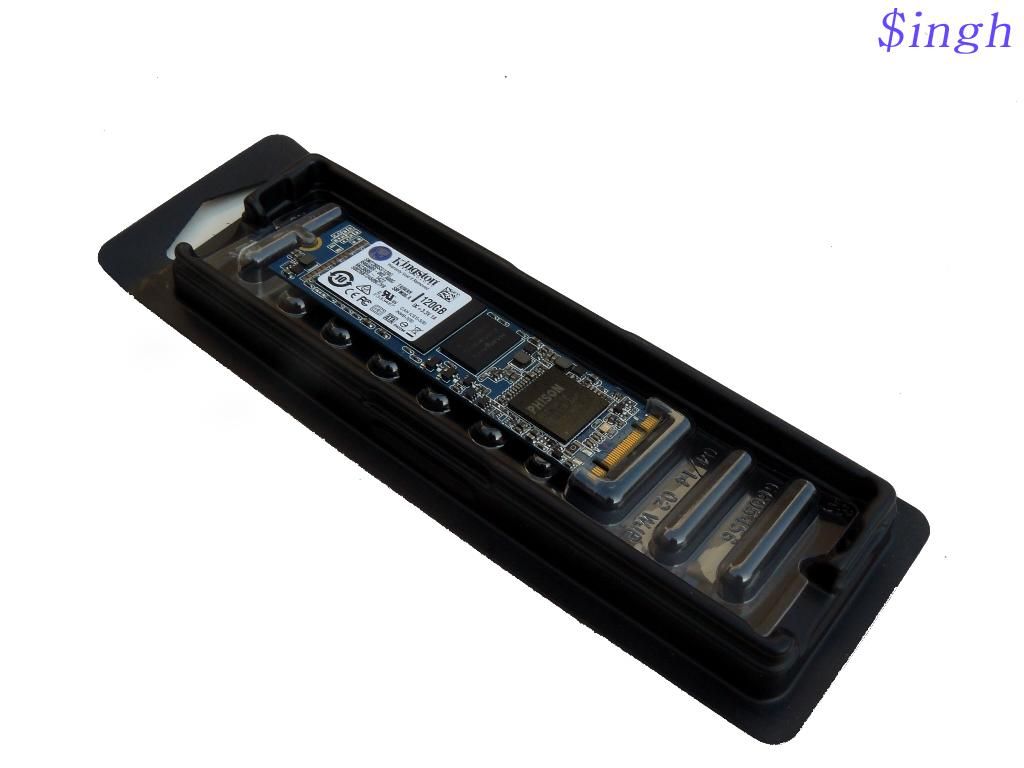
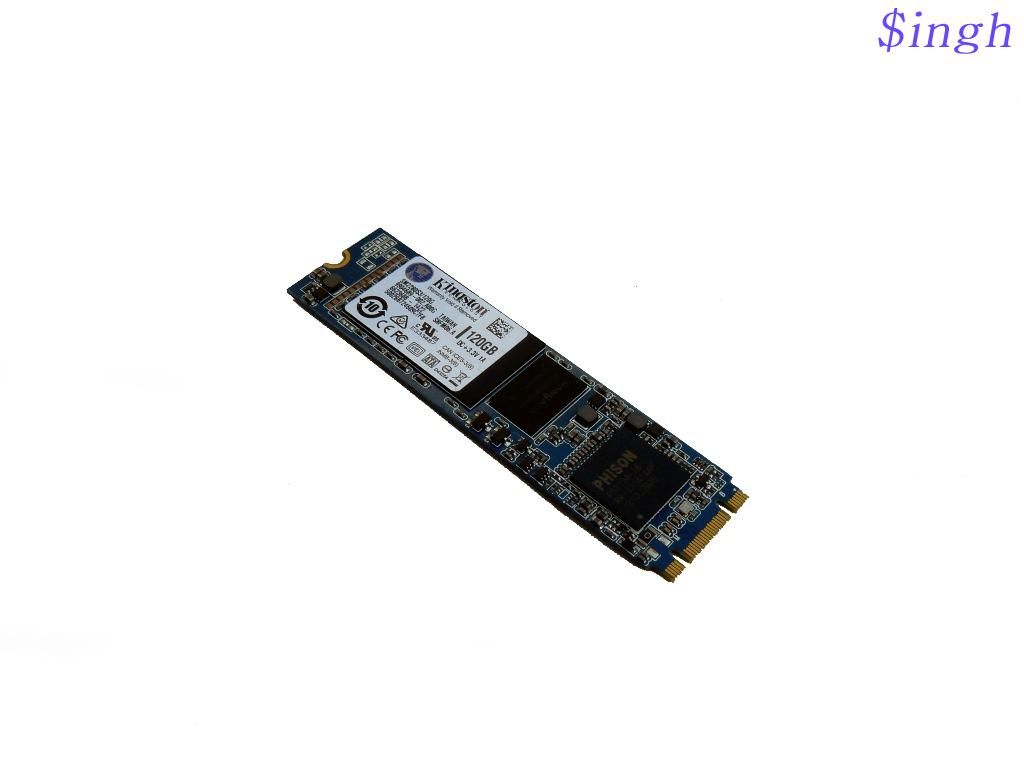
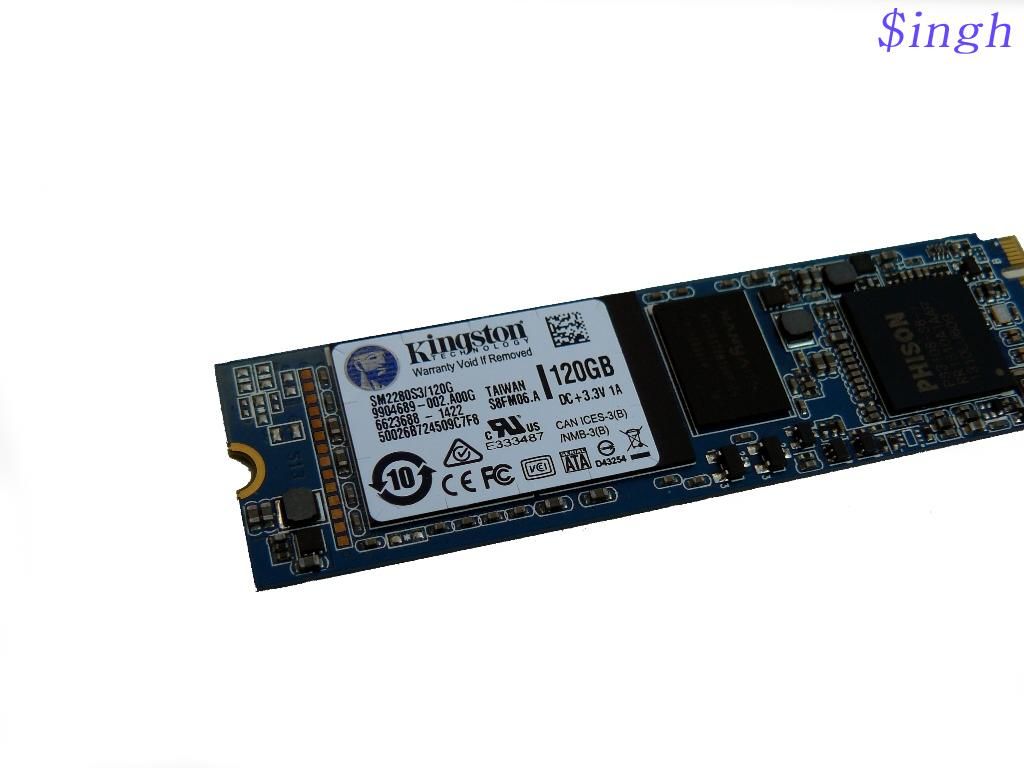
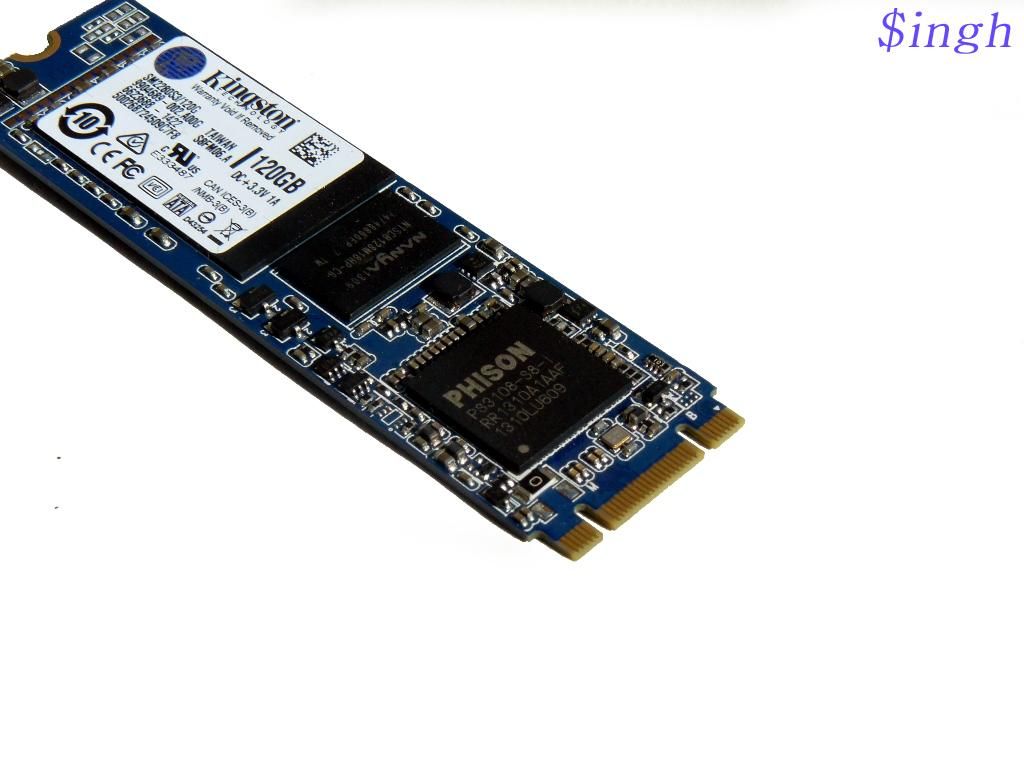
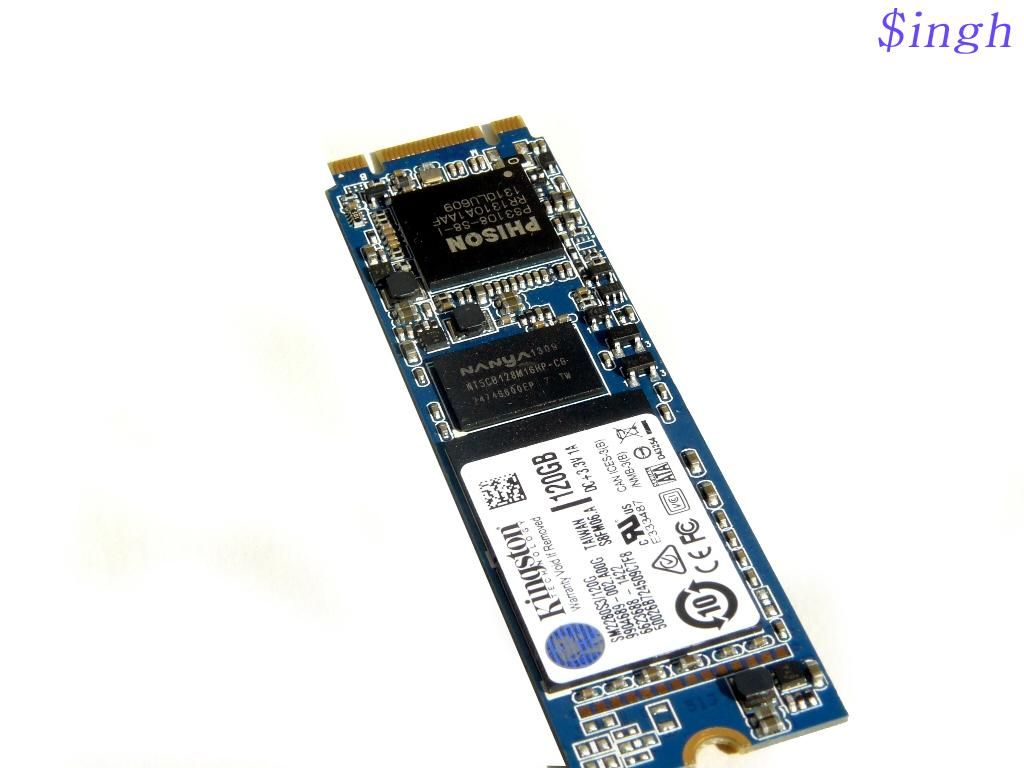
A new generation m2 sata ssd came out in the market this year with the advent of Z97 series motherboards. These motherboards have M.2 slot which is basically evolved version of mSATA. This form factor provides bandwidth up to 10 gb/s with some fastest read and write speeds. Kingston announced its M.2 SM2280S3 SSD some time back that comes in 120 and 240GB variants. They send 120GB variant to us for review. Let's see how good this M.2 SSD is
Features
· Popular M.2 Size — 22mm width, 80mm length
· NAND Flash memory based — shock resistant with lower power consumption
· Supports Intel’s SRT — combines capacity advantage of HDD with performance improvements of SSD in dual-storage configuration
· Supports S.M.A.R.T. — monitors the status of your drive
· Supports TRIM — maintains maximum performance of compatible operating systems
· Guaranteed — 3-year warranty and free technical support
Specifications
· Form factor: M.2 2280
· Interface: SATA Rev. 3.0 (6Gb/s) – with backwards compatibility to SATA Rev. 2.0
· Capacities: 120GB
· Power Consumption: 0.09 W Idle / 1.11 W Avg / 1.02W (MAX) Read / 2.86 W (MAX) Write
· Storage temperatures: -40°C ~ 85°C
· Operating temperatures: 0°C ~ 70°C
· Dimensions: 80mm x 22mm x 3.5mm
· Weight: 7.36g
· Vibration operating: 2.17G Peak (7–800Hz)
· Vibration non-operating: 20G Peak (10–2000Hz)
· Life expectancy: 1 million hours MTBF
· Warranty/support: 3-year warranty with free technical support
Baseline Performance: (As per Kingston)
· Compressible Data Transfer (ATTO) 550MB/s Read and 520MB/s Write
· Incompressible Data Transfer (AS-SSD and CrystalDiskMark) 500MB/s Read and 330MB/s Write
· IOMETER Maximum Random 4k Read/Write up to 66,000/ up to 65,000 IOPS
· Random 4k Read/Write up to 46,000/ up to 4,500 IOPS
· PCMARK® Vantage HDD Suite Score 56,000
· PCMARK® 8 Storage Bandwidth 215 MB/s
Preview
Test Setup and Testing methodology
· Intel core i7 4770k
· Asus Z97 Pro
· Kingston Hyper-x 16 GB
· Gigabyte Hd7970
· Kingston Uv100 120 GB
· SEASONIC PLATINUM 1000W
METHODOLOGY
I am running a variety of tests, that when viewed together as a whole, should provide a “big picture” result. These tests will allow you to gauge how your SSD compares with Kingston SM2280S3 M.2 SSD. I am posting screen shots of the benchmarks so you can easily recognize the results in the manner you are accustomed to seeing.
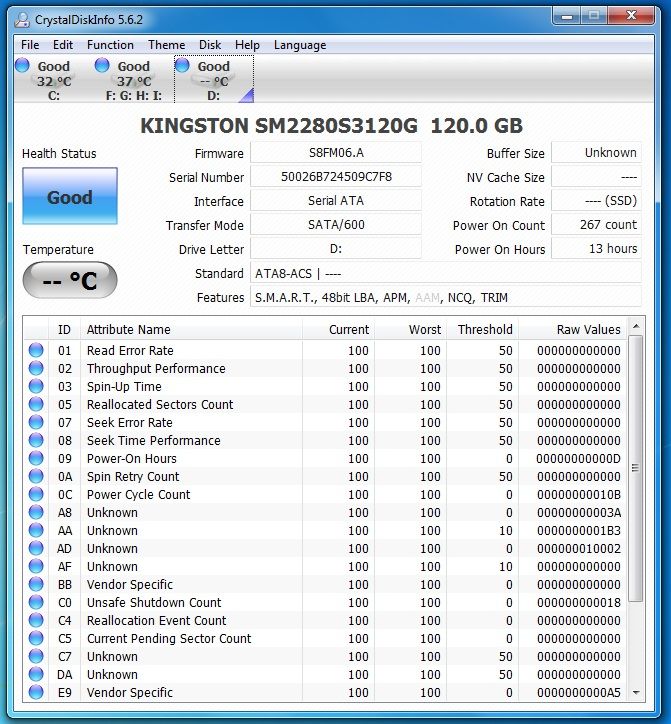
Crystal Diskmarkinfo
Benchmarks
ATTO
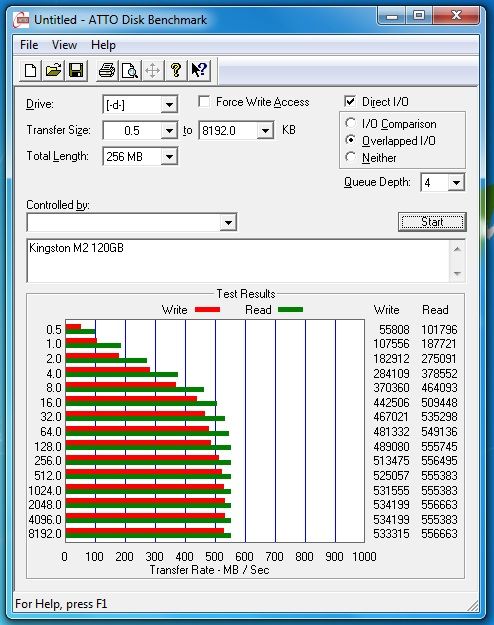
First up is of course ATTO. ATTO is universally used by SSD manufacturers to show what the drives maximum read/write capabilities are under ideal circumstances. The bandwidth results here are not necessarily entirely reliable for reporting the maximum drive speeds, but it does help convey results of the bandwidth for different file sizes.
AIDA64
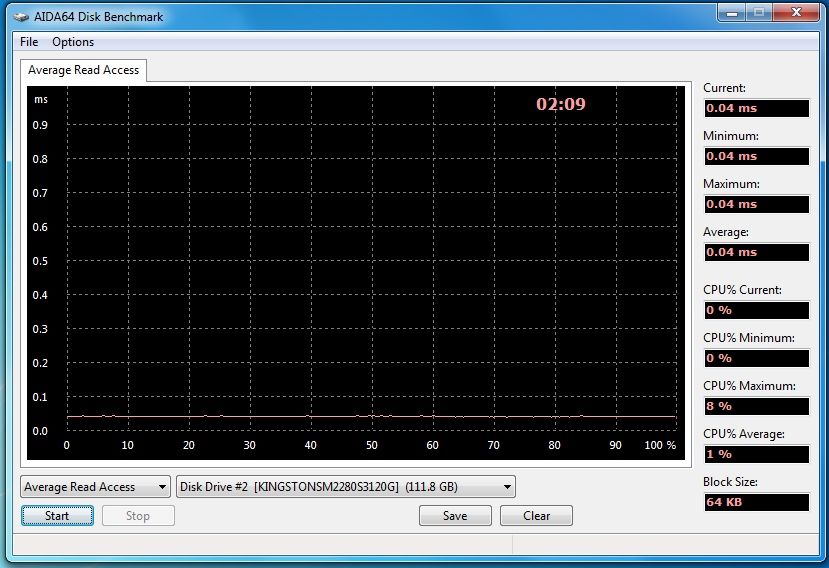
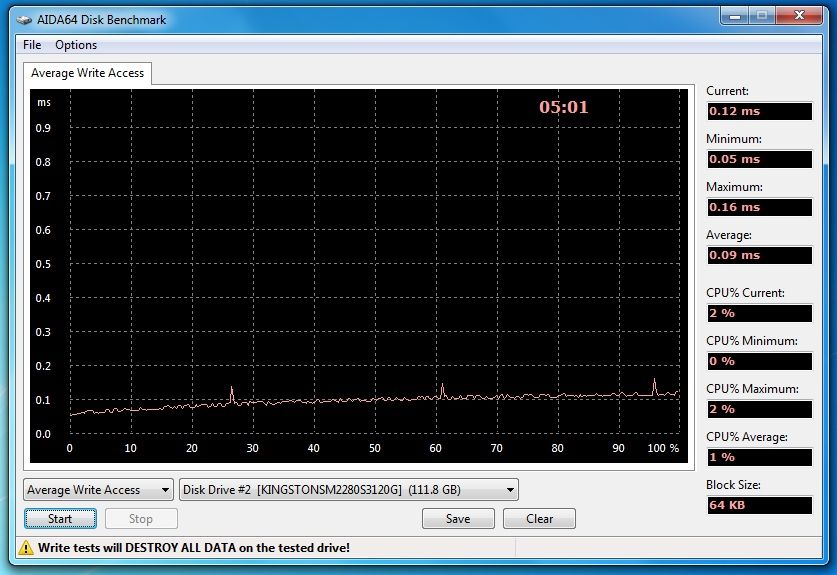
AIDA64 Extreme Edition is streamlined Windows diagnostic and benchmarking software. AIDA64 Extreme Edition provides a wide range of features to assist in overclocking, hardware error diagnosis, stress testing, and sensor monitoring. It has unique capabilities to assess the performance of the processor, system memory, and disk drives. AIDA64 is compatible with all current 32-bit and 64-bit Microsoft Windows operating systems, including Windows 7 and Windows Server 2008 R2.
We will be using AIDA64 to gauge access times across the entire drive. Beware that using any write testing with AIDA64 will destroy ALL data on the drive and it will be left in a RAW State when finished.
Average Read Access time across entire drive:
Average Write Access time across entire drive:
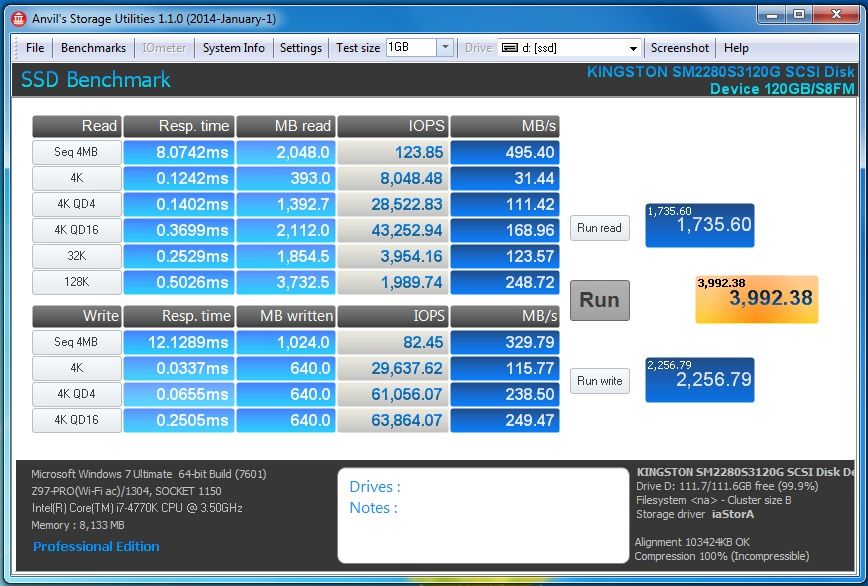
ANVIL
Next up we have Anvil’s Storage Utilities a new piece of software specifically designed to measure SSD performance. We believe this software will become the gold standard by which SSD performance will be measured in the future. It’s simple to use and its full of features such endurance testing and threaded I/O read, write and mixed tests, all of which are simple to understand and easy to use. Let’s see how we do.
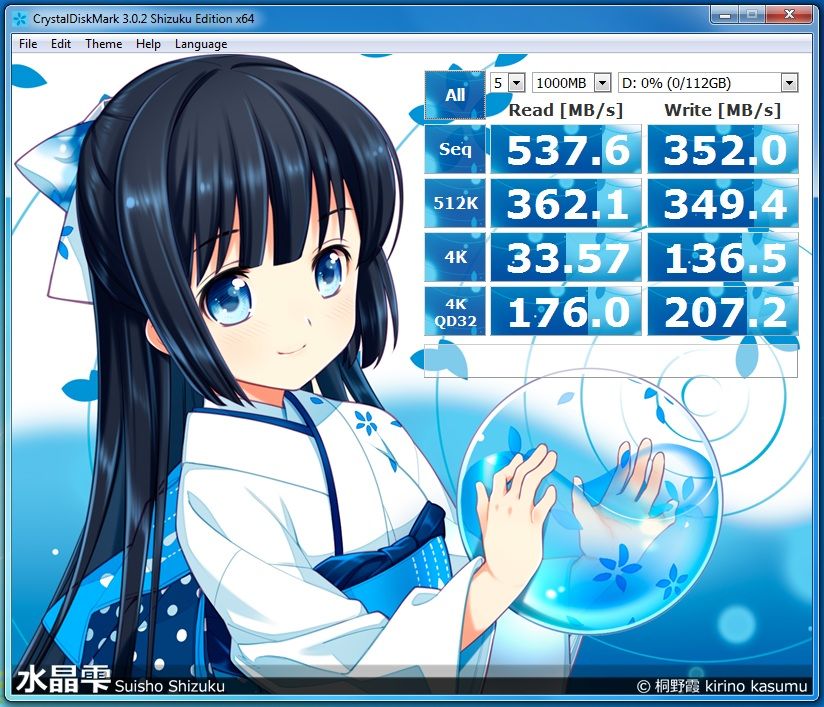
CRYSTALDISK MARK
Next we will test with Crystal Disk Mark. Crystal Disk Mark is a lightweight benchmark that has two parameters, Sequential and Random read/write, to evaluate the performance of a drive. Crystal Disk Mark’s default test uses random data and the writes in particular can be very punishing on SandForce drives. First up we will test with default random data.
HD TUNE
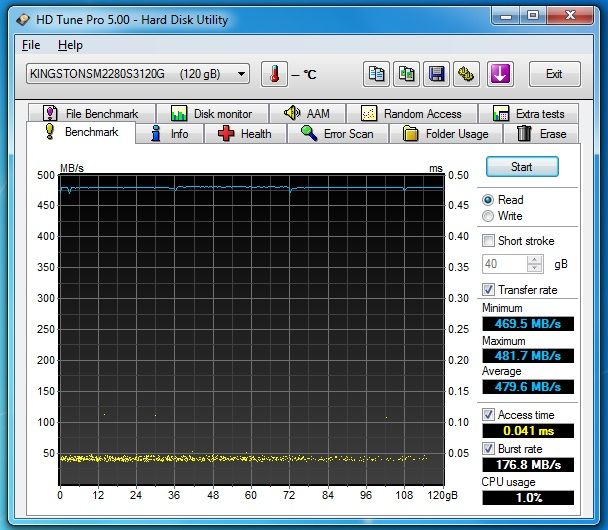
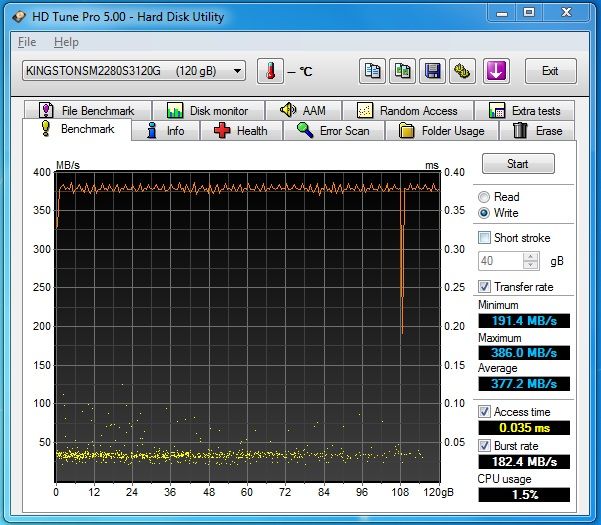
HDTune Pro is one of the most popular hard drive software suites available. It has many different benchmarks and tests built into it. Unlike the other benchmarks which just give averages, HD Tune gives us insight as to exactly what the drive is doing with its graph.
Read
Write
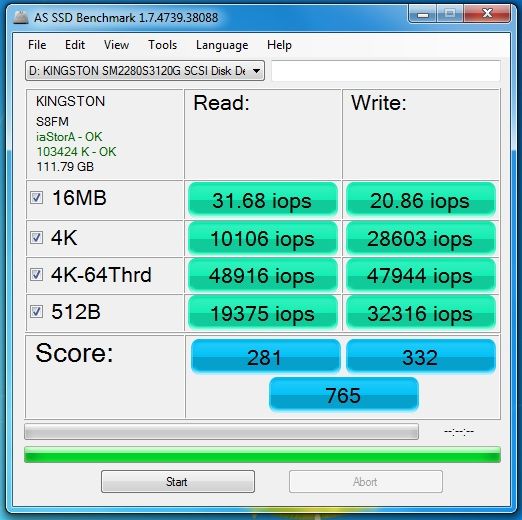
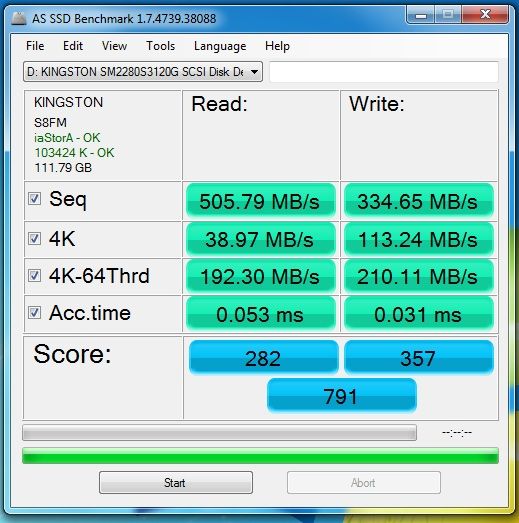
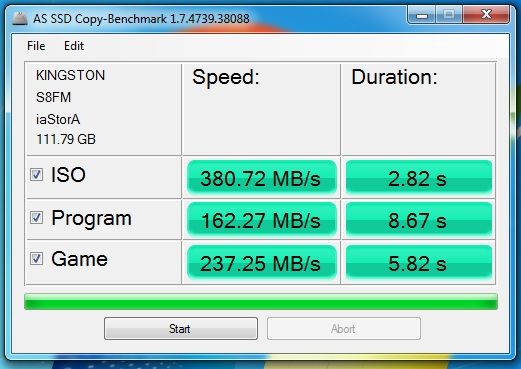
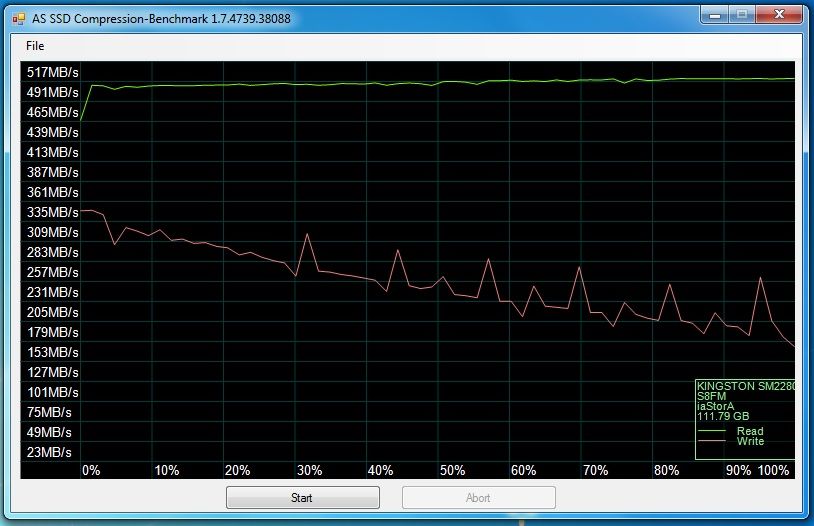
AS-SSD
Next up is AS SSD, which is the most punishing test of all for a SandForce Drive. This test gives us the worst case scenario in SSD transfer speeds because of its use of incompressible data.
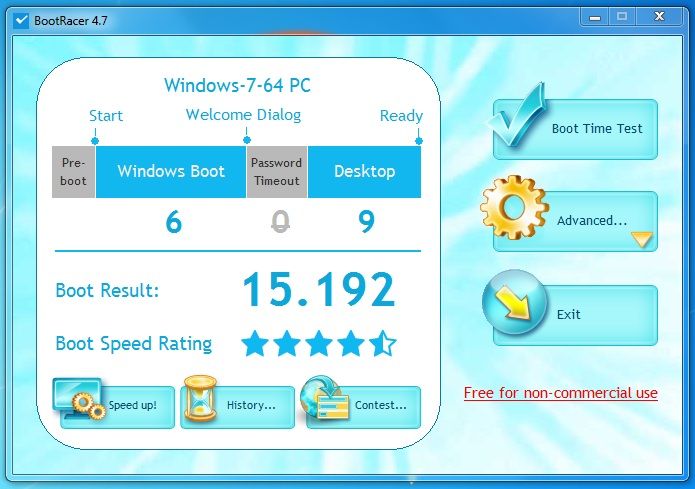
Window boot time
Conclusion
Considering performance it`s an average ssd that comes in the area where most mid-market to budget ssd float in. Read speeds are good while write speeds are average and overall a norm performance. The noticeable thing is that SM2280S3 is a smaller version of an ordinary 2.5″ SSD. Moreover, using the M.2 socket, you won’t have cables around the case that helps improving cable management. Anyone looking for M.2 capable device needing a Next Generation Form Factor solution can find SM2280S3 a good option to consider.
Note:- Be aware while buying M2 ssd as most motherboards comes with integrated M.2 slot, even while M.2 slots have the same connections, it doesn’t mean they will work with all M.2 SSDs. Some M.2 slots are PCIe only and others are SATA only. This means they only allow for the M.2 SSD to transmit information over the PCIe bus or SATA bus, so do check compatibility first before buying.
The Good
Good write speed
Compact design
3 years warranty
Easy installation
The Bad
Average Write speeds
Specially Thanks to Kingston for providing the sample.

